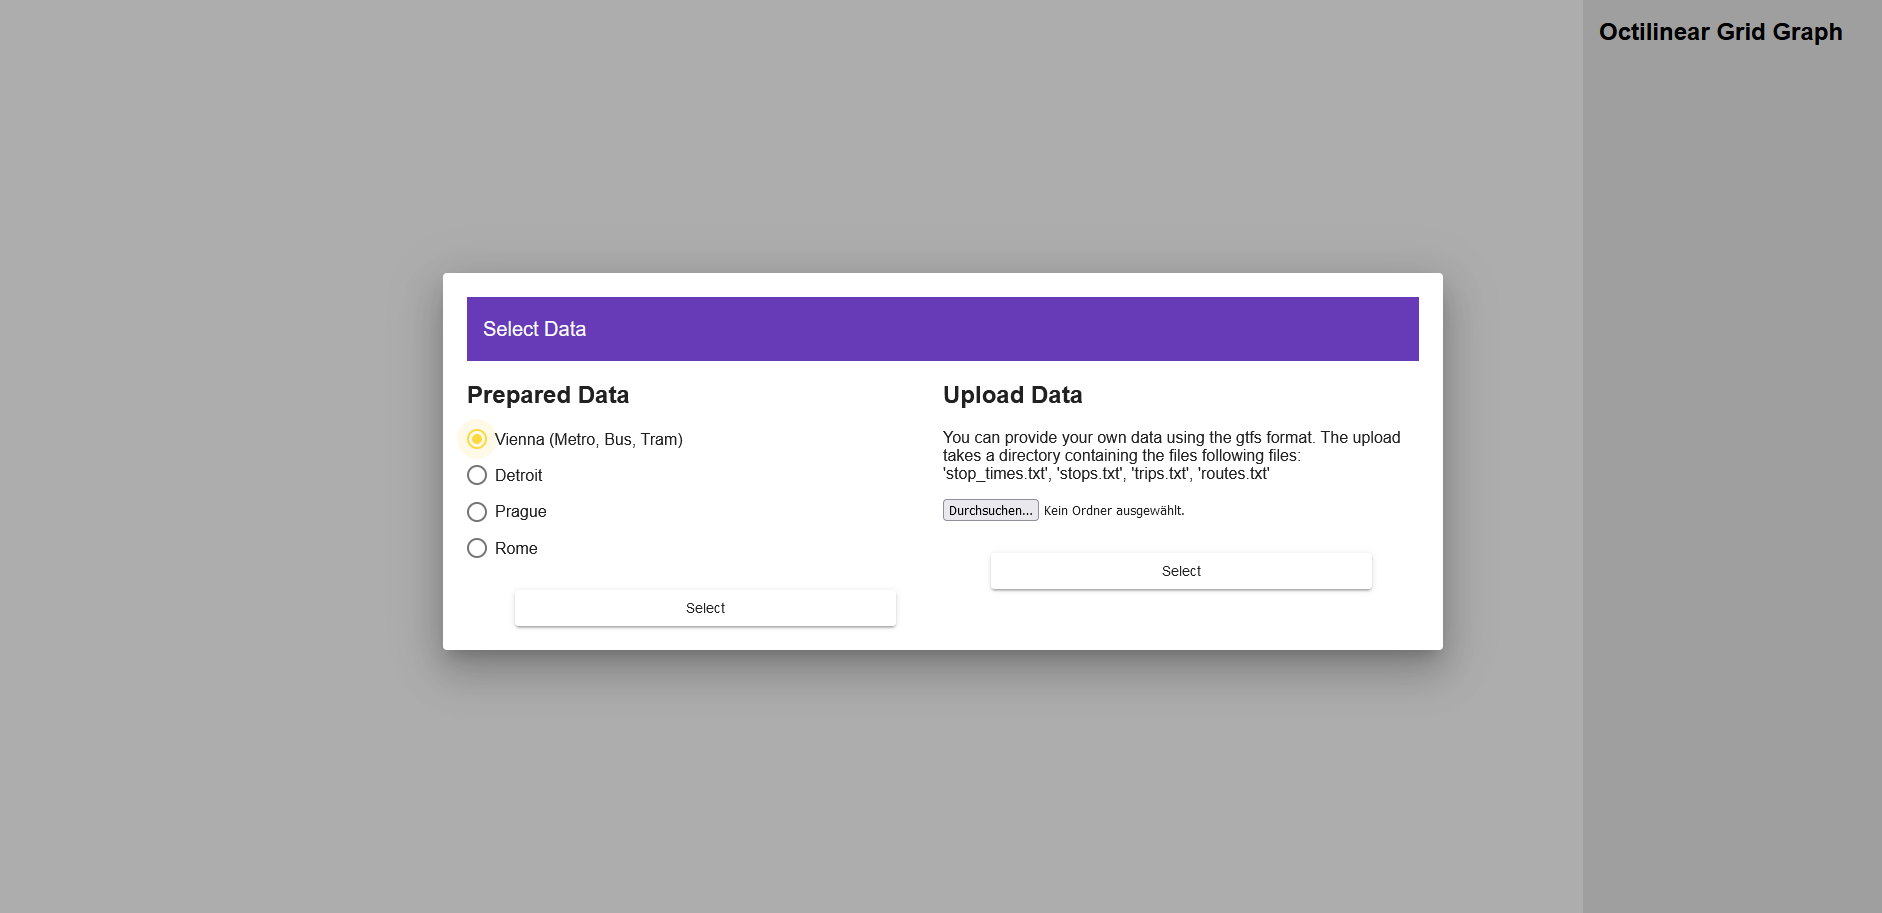
In the first step a user can select one of the five prepared datasets (Vienna, Rome, Prague, Detroit and Stuttgart) or choose to upload a new dataset in the gtfs format.
In the first step a user can select one of the five prepared datasets (Vienna, Rome, Prague, Detroit and Stuttgart) or choose to upload a new dataset in the gtfs format.
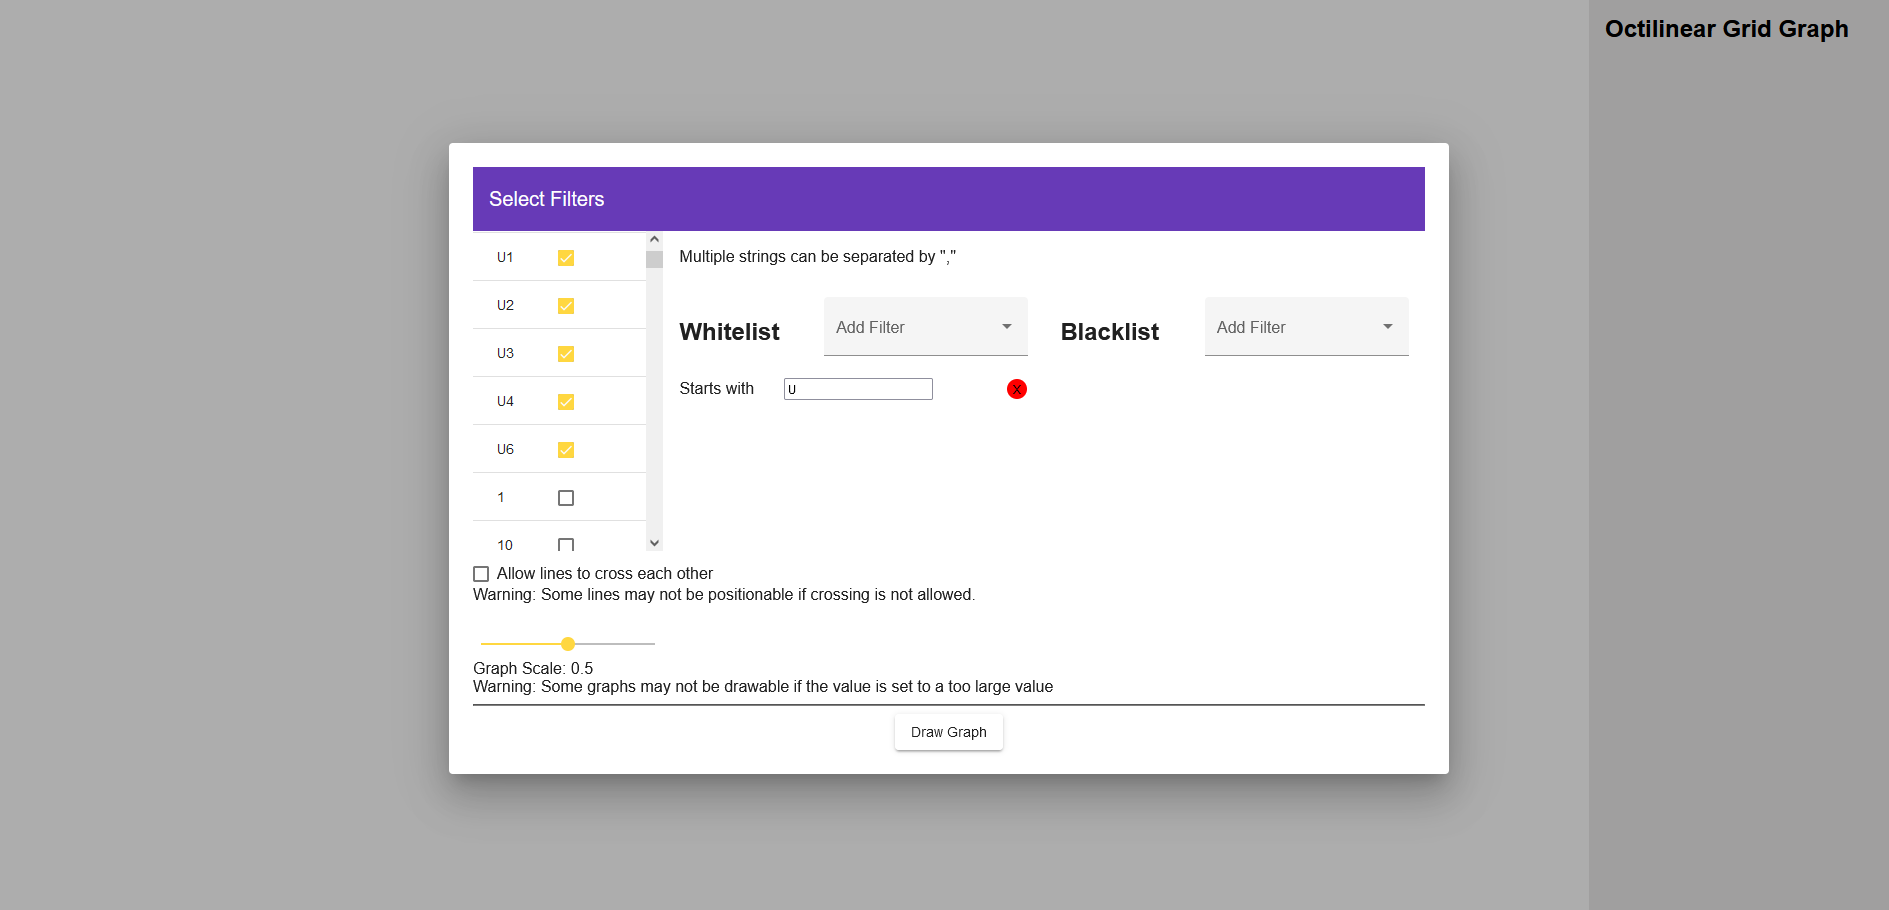
The data can then be filtered by different blacklist and whitelist filters, allowing to create custom maps. Supported filters are: filtering by route type (i.e. subway, tram...), and different text matching filters using the line names. At the bottom, the user can choose if lines are allowed to cross each other in the graph and set the scale of the drawn graph.
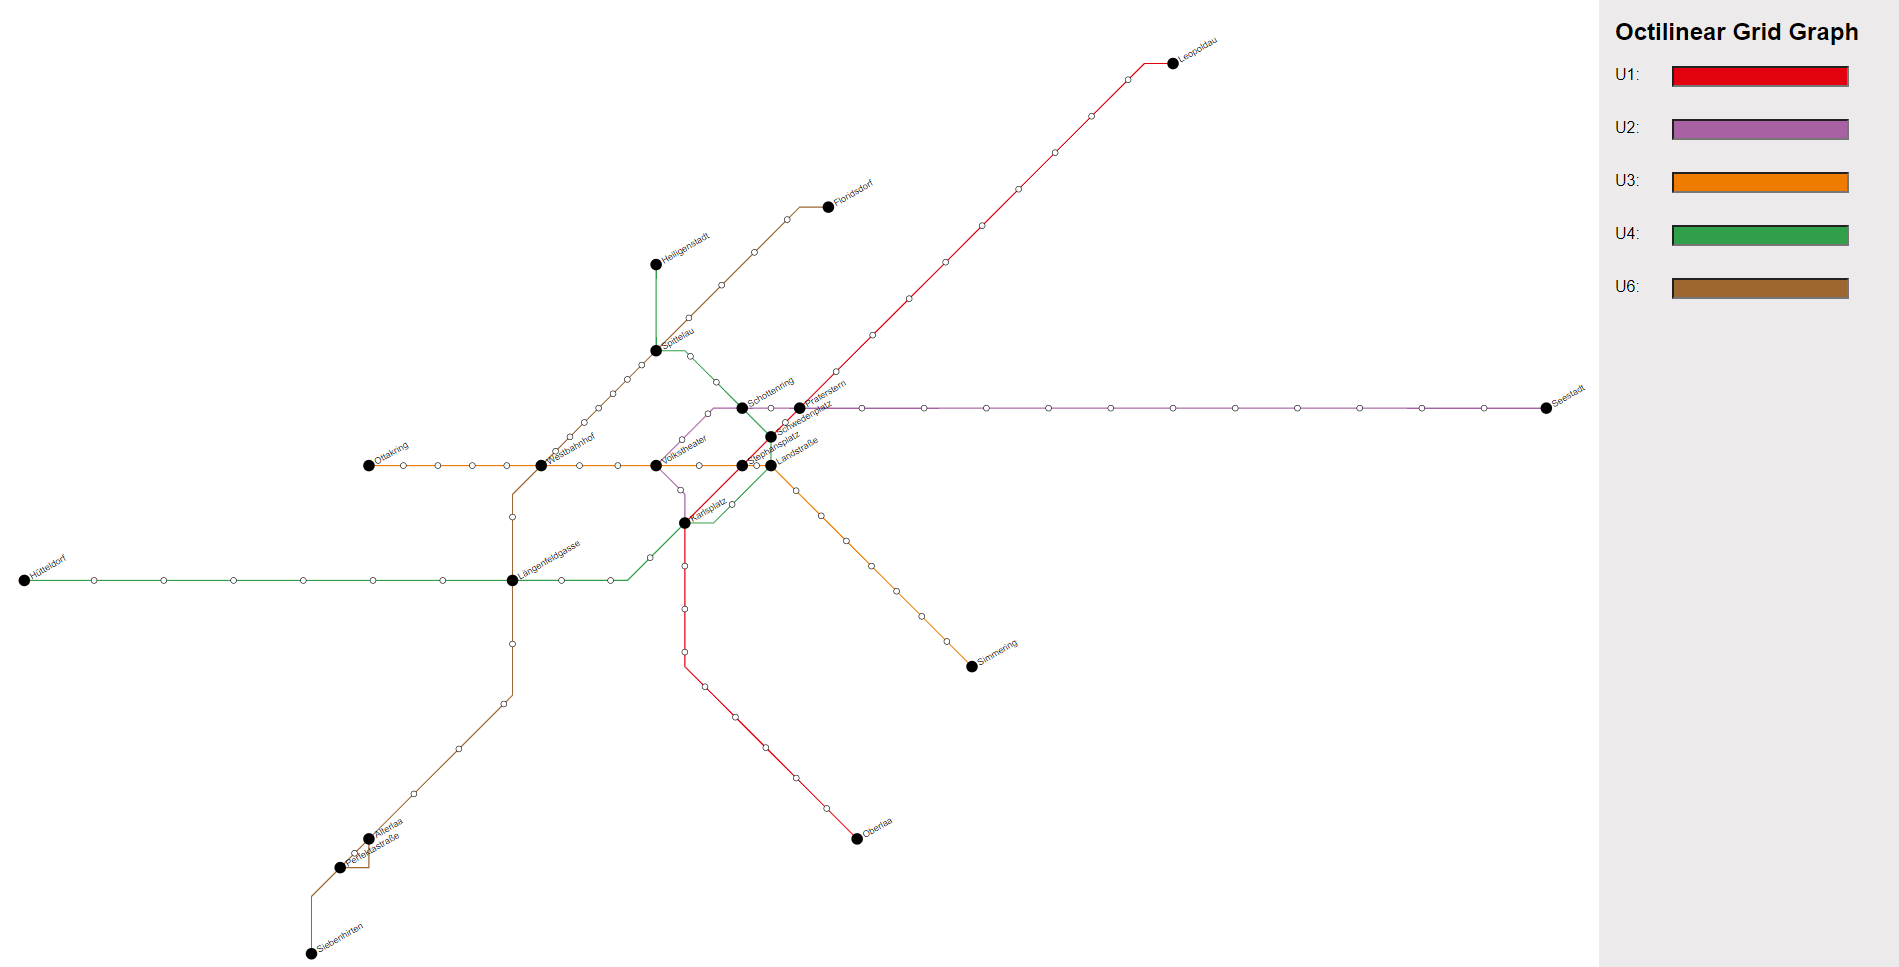
When the lines have been chosen, the algorithm runs and afterwards the graph is drawn in the browser. On the right side of the window is a list of all lines with their default colours. The algorithm takes onlya few seconds for smaller datasets and can take more than a minute for larger ones. If no colour was specified in the data, the colour is set to black. With a click on the colour bar, the colour can be adjusted for each line individually. When hovering over the graph elements, the name of the lines and the stations are shown and the lines are highlighted.